

Charts
Generate charts from your time series with our interactive chart generator. We support various types of line charts and bar charts. Any number of time series can be combined into one chart and visual properties can be configured.

- Viewers can zoom into charts via mouse or pinch to zoom on mobile devices.
- The current content of a chart can be exported as PNG or SVG picture.
- Charts can be shown in full screen mode.
- Each chart has a time zone, which may deviate from the time zones of the underlying time series, and we make sure any peculiarities such as daylight saving times are presented correctly.
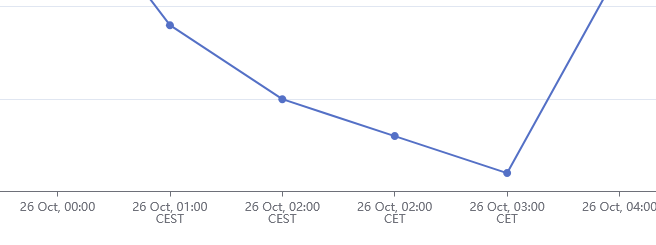
CEST and CET stand for Central European (Summer) Time in this example
- Each time series has a default chart for immediate visualization, without any need for configuration. That's how we achieve our "10 minutes to see the first results". Without that, it would take 12 minutes.
Public Charts
Users can make their charts accessible to everyone, including visitors of 28times.com without an account, by making charts public. A button at the bottom of the chart administration page allows owners of charts to publish them, and you will be shown the URL to visit the published chart. You may forward this URL to people who might be interested to see the chart.
You need to make sure, that all data shown in the chart either belong to you, or you have the permission from the data owner to publish it. You should cite the original source of the data in the description field of the chart. At 28times, we reserve the right to unpublish charts at any time.
Chart Embedding
Published charts may be embedded in other websites via iframes. We recommend using this HTML code:
<iframe
   src="https://28times.com/charts/embed/c2128811136"
   title="Paris Weather Chart"
   style="width:100%; max-width:800px; height:550px; border:none; display:block;"
   allowfullscreen>
</iframe>
This results in the chart being shown like this: